Contents
Prometheus技术基础
1.Exporter
Prometheus核心组件中,Exporter是重要的组成部分,在实际中监控样本数据的收集都是由Exporter完成的,Prometheus服务器只需要定时从这些Exporter提供的HTTP服务获取监控数据即可。
本章将对Exporter的类型以及文本数据格式进行说明,讨论如何从官方的Exporter列表获取常用的Exporter,比如用于监控基础设施中服务器性能的node_exporter、wmi_exporter,用于对数据库监控的mysqld_exporter和redis_exporter等。
并对这些获取特定目标监控样本数据的Exporter软件包进行安装集成,最终可以很直观地通过Prometheus Web UI浏览采集到的各类监控数据。
2.Exporter类型
通常来说可以将Exporter分为两类:
直接采集型。这类Exporter直接内置了相应的应用程序,用于向Prometheus直接提供Target数据支持。这样设计的好处是,可以更好地监控各自系统的内部运行状态,同时也适合更多自定义监控指标的项目实施。例如cAdvisor、Kubernetes等,它们均内置了用于向Prometheus提供监控数据的端点。
间接采集型。原始监控目标并不直接支持Prometheus,需要我们使用Prometheus提供的Client Library编写该监控目标的监控采集程序,用户可以将该程序独立运行,去获取指定的各类监控数据值。例如,由于Linux操作系统自身并不能直接支持Prometheus,用户无法从操作系统层面上直接提供对Prometheus的支持,因此单独提供Node exporter,还有数据库或网站HTTP应用类等Exporter。
2.1 文本数据格式
Prometheus的所有流程都需要使用基于文本的格式。现在我们可以使用浏览器访问已经部署完成的metrics,可以从Prometheus Web UI提供的页面http://192.168.24.17:9090/metrics来获取信息.
# HELP go_gc_duration_seconds A summary of the GC invocation durations.
# TYPE go_gc_duration_seconds summary
go_gc_duration_seconds{quantile="0"} 1.6686e-05
go_gc_duration_seconds{quantile="0.25"} 2.3724e-05
go_gc_duration_seconds{quantile="0.5"} 3.4785e-05
go_gc_duration_seconds{quantile="0.75"} 5.5535e-05
go_gc_duration_seconds{quantile="1"} 0.000209371
go_gc_duration_seconds_sum 0.017473216
go_gc_duration_seconds_count 304
# HELP go_goroutines Number of goroutines that currently exist.
# TYPE go_goroutines gauge
go_goroutines 88
# HELP go_info Information about the Go environment.
# TYPE go_info gauge
go_info{version="go1.13.4"} 1
# HELP go_memstats_alloc_bytes Number of bytes allocated and still in use.
# TYPE go_memstats_alloc_bytes gauge
go_memstats_alloc_bytes 4.170512e+07
# HELP go_memstats_alloc_bytes_total Total number of bytes allocated, even if freed.
# TYPE go_memstats_alloc_bytes_total counter
go_memstats_alloc_bytes_total 7.036375856e+09
# HELP go_memstats_buck_hash_sys_bytes Number of bytes used by the profiling bucket hash table.
# TYPE go_memstats_buck_hash_sys_bytes gauge
go_memstats_buck_hash_sys_bytes 1.871112e+06
# HELP go_memstats_frees_total Total number of frees.
这些样本数据集合说明如下:
·以#HELP开始的行,表示metric的帮助与说明注释,可以包含当前监控指标名称和对应的说明信息。

·以#TYPE开始的行,表示定义metric类型,可以包含当前监控指标名称和类型,类型有Counter、Gauge、Histogram、Summary和Untyped。

·以非#开始的行,即监控样本数据。

·其他一般性注释,方便阅读使用,会被Prometheus忽略。
2.2 获取Exporter
Prometheus Exporter社区很活跃,提供了支持120+常见开源组件的Exporter,
一些比较有名的技术厂商都专门编写对应的Prometheus Exporter,例如,Oracle编写的Weblogic Exporter,IBM编写的IBM MQ exporter,Kubernetes、etcd都直接内置了基于Exporter规范的Metrics。
在众多的第三方提供的Exporter中,有一些Exporter作为Prometheus GitHub官方组织的一部分进行维护,这些Exporter会被标记为官方。
可以在Prometheus官网https://prometheus.io/docs/instrumenting/exporters/
里看到常用的Node/system metrics exporter(official)和MySQL server exporter(official)。在这些Exporter的名称末尾都标示了(official),即官方进行维护的Exporter。
我们也可以直接到Prometheus GitHub官网https://github.com/prometheus上获取对应的Exporter最新版本。
我们将以下演示环境中用到的应用信息进行汇总,方便大家后续操作中查看
2.2.1 测试主机列表及其软件
名称 |
IP地址 |
软件信息 |
端口 |
|---|---|---|---|
prometheus |
192.168.1.x |
prometheus-2…. |
9090 |
Grafana |
192.168.1.x |
grafana-….zip |
3000 |
Linux主机 |
192.168.1.x |
node_exporter-0….linux… |
9100 |
Windows主机 |
192.168.1.x |
wmi_exporter-0…msi |
9182 |
MySQL主机 |
192.168.1.x |
mysqld_exporter….linux… |
9104 |
Redis主机 |
192.168.1.xx |
redis-exporter….linux… |
9121 |
Nginx主机 |
192.168.1.xxx |
nginx-vts-exporter-….linux… |
9913 |
Blackbox Exporter主机 |
192.168.1.xx |
blackbox_exporter-….linux… |
9115 |
2.2.2 软件下载清单
自行百度下载
2.2.3 主机监控
1 Linux主机监控
1.下载部署
在安装之前,首先在官方下载页面https://prometheus.io/download/找到Nodeexporter列表,下载最新版本中特定平台的二进制文件。
或者直接在官方的Prometheus GitHub下载,在https://github.com/prometheus/node_exporter/releases下载指定的Node exporter版本所对应的特定平台的二进制文件。然后开始Node exporter的安装部署以及使用。
$ curl -OL https://github.com/prometheus/node_exporter/releases/download/v1.1.2/node_exporter-1.1.2.linux-amd64.tar.gz

$ tar zxvf node_exporter-1.1.2.linux-amd64.tar.gz
$ cd node_exporter-1.1.2.linux-amd64
$ mkdir /data/node_exporter
$ mv node_exporter /data/node_exporter/

[root@cicd-dev node_exporter]# ./node_exporter
INFO[0000] Starting node_exporter (version=0.16.0, branch=HEAD, revision=d42bd70f4363dced6b77d8fc311ea57b63387e4f)  source="node_exporter.go:82"
INFO[0000] Build context (go=go1.9.6, user=root@a67a9bc13a69, date=20180515-15:52:42)  source="node_exporter.go:83"
INFO[0000] Enabled collectors:                           source="node_exporter.go:90"
INFO[0000]  - arp                                        source="node_exporter.go:97"
INFO[0000]  - bcache                                     source="node_exporter.go:97"
INFO[0000]  - bonding                                    source="node_exporter.go:97"
INFO[0000]  - conntrack                                  source="node_exporter.go:97"
INFO[0000]  - cpu                                        source="node_exporter.go:97"
INFO[0000]  - diskstats                                  source="node_exporter.go:97"
INFO[0000]  - edac                                       source="node_exporter.go:97"
INFO[0000]  - entropy                                    source="node_exporter.go:97"
INFO[0000]  - filefd                                     source="node_exporter.go:97"
INFO[0000]  - filesystem                                 source="node_exporter.go:97"
INFO[0000]  - hwmon                                      source="node_exporter.go:97"
INFO[0000]  - infiniband                                 source="node_exporter.go:97"
先在终端界面启动node_exporter,成功启动后可以看到默认监听端口是9100,其中“Enabled
collectors”列是node_exporter默认情况下启用的功能。如果想更换默认监控端口,需要启动时添加参数--web.listen-address="0.0.0.0:9200"即可,更多方法可以使用#./node_exporter-h查看相关帮助信息。
添加node_exporter为系统服务开机启动
$ cat >/usr/lib/systemd/system/node_exporter.service <<EOF
[Unit]
Description=node_exporter
Documentation=https://prometheus.io/
After=network-online.target
[Service]
Type=simple
User=root
Group=root
ExecStart=/data/node_exporter/node_exporter
Restart=on-failure
[Install]
WantedBy=multi-user.target
EOF
设置开机自启动
systemctl daemon-reload
systemctl enable node_exporter
systemctl stop node_exporter
systemctl start node_exporter
$ ps aux |grep node_exporter
992      12057  0.1  0.1  22216 11352 ?        Ssl  Feb04  52:32 /opt/gitlab/embedded/bin/node_exporter --web.listen-address=localhost:9100 --collector.textfile.directory=/var/opt/gitlab/node-exporter/textfile_collector
root     25878  0.0  0.0 113404  5768 ?        Ssl  09:34   0:00 /data/node_exporter/node_exporter
至此,我们完成了对node_exporter的下载安装,并对其进行了系统服务添加和开机自启动设置。
2.与Prometheus集成
当启动node_exporter在后台开始工作时,node_exporter和Prometheus还没有进行对接关联,此时,二者只是各自独立运行的应用程序。现在需要将已安装部署好的node_exporter添加到Prometheus服务器中。可以在Prometheus主机目录中,找到主配置文件,使用其中的静态配置功能static_configs来采集node_exporter提供的数据。
在默认配置文件的基础上,重新编辑prometheus.yml文件,添加job与node_exporter进行关联的参考配置内容如下:
- job_name: 'prometheus'
  static_configs:
  - targets: ['localhost:9090']

- job_name: 'node_exporter'
  static_configs:
  - targets: ['192.168.1.27:9100']
注意,这里的YAML语法空格缩进;prometheus.yml配置文件中的prometheus和node_exporter均部署不同的主机上。
进入Targets页面后,可以在列表中看到刚才配置好的node_exporter的状态为“UP”,说明Prometheus最后一次从Node exporter中采集数据是成功的,此刻,被监控的服务器主机工作运行状态是正常的。

当然,我们也可以使用浏览器访问Prometheus web UI提供的graph页面地址http://192.168.1.37:9090/graph,在搜索框中输入“up”进行搜索,或者直接在“Execute”按钮后的选项框中,点击下拉按钮选择最末尾的“up”,再点击“Execute”进行搜索.
3.metrics查看
Node exporter服务正常运行时,使用浏览器访问被监控主机的页面地址http://192.168.1.37:9090/metrics,可以直接查看当前被监控主机的样本信息。列举以下常见的几类监控指标。
我们也可以在Prometheus Web UI中的Graph页面中查询到node_memory_MemTotal_bytes信息
由于与内存数据采集相关的metric太多了,在此我们就不一一列举说明,
例如node_memory_MemAvailable_bytes、node_memory_MemFree_bytes、node_memory_SwapFree_bytes等。
然后配置grafana仪表盘,模板选择:
9276模板
14513模板
导入模板即可采集。
编写了一个采集linux主机metrics的脚本
node_exporter.sh
#!/bin/bash
# Notes: 本脚本用于在服务器上安装node-exporter
# TIPS: 生产环境不建议使用 Docker部署node-exporter

wget https://github.com/prometheus/node_exporter/releases/download/v1.1.2/node_exporter-1.1.2.linux-amd64.tar.gz
tar xvf node_exporter-1.1.2.linux-amd64.tar.gz
mv node_exporter-1.1.2.linux-amd64 /usr/local/bin/node_exporter

groupadd prometheus
useradd -g prometheus -m -d /var/lib/prometheus -s /sbin/nologin prometheus
mkdir /usr/local/prometheus
chown prometheus.prometheus -R /usr/local/prometheus

cat > /etc/systemd/system/node_exporter.service << EOF
[Unit]
Description=node_exporter
Documentation=https://prometheus.io/
After=network.target
[Service]
Type=simple
User=prometheus
ExecStart=/usr/local/bin/node_exporter/node_exporter --collector.processes  --collector.filesystem.ignored-mount-points=^/(sys|proc|dev|host|etc)($$|/)
Restart=on-failure
[Install]
WantedBy=multi-user.target
EOF

systemctl daemon-reload
systemctl restart node_exporter.service
systemctl enable node_exporter.service

systemctl start node_exporter.service
systemctl status node_exporter
批量安装node_exporter脚本
# github地址:
https://github.com/zhuqiyang/install-node_exporter-shell
docker部署node_exporter(生产环境不建议使用)
$ docker run -d -p 9100:9100 \
  --restart=always \
  -h node_exporter \
  --name node-exporter \
  prom/node-exporter
2 Windows主机监控
下载页面地址:https://github.com/martinlindhe/wmi_exporter/releases。选择当前最新版本:wmi_exporter-0.5.0-amd64.msi下载到被监控主机。直接双击文件进行快速安装即可。wmi_exporter会自动安装到C:_exporter目录下,安装程序将WMI Exporter设置为Windows服务,并在Windows防火墙中创建入站规则“WMI Exporter(HTTP 9182)”。WMIExporter自动启动运行后,可以启用Windows任务管理,在进程中找到wmi_exporter.exe进程。
在wmi_exporter默认运行情况下,启用了cpu、cs、logical_disk、net、os、service、system、textfile采集监控内容。其他默认没有启用的采集监控内容可以访问GitHub网站https://github.com/martinlindhe/wmi_exporter/blob/v0.5.0/README.md页面进行查看。
后续补充
2.2.4 数据库监控
1 MySQL Server exporter
1.软件下载与部署
在安装之前,可以在官方下载页面https://prometheus.io/download/中找到mysqld_exporter列表,下载最新版本中特定平台的二进制文件。同样也可以直接在官方的Prometheus GitHub下载页面https://github.com/prometheus/mysqld_exporter/releases中下载指定的mysqld_exporter版本所对应特定平台的二进制文件。
部署可分为以下6个步骤。
1)下载mysqld_exporter
2)解压缩软件包到指定的安装目录。
3)创建MySQL授权用户。连接到MySQL服务器,创建一个用户,例如“mysqld_exporter”。该用户需要拥有PROCESS,SELECT,REPLICATION CLIENT授权,且为了避免有些高负载MySQL服务器过载,为用户设置最大连接限制。可以进行如下操作:
mysql> create user 'mysqld_exporter'@'localhost' IDENTIFIED BY 'OSChina@2021';
Query OK, 0 rows affected (0.05 sec)


mysql> grant process, replication client,select on *.* to 'mysqld_exporter'@'localhost';
Query OK, 0 rows affected (0.00 sec)

mysql> flush privileges;
Query OK, 0 rows affected (0.01 sec)

mysql> select host,user from mysql.user;
+-----------+------------------+
| host      | user             |
+-----------+------------------+
| %         | crm              |
| %         | gitee_production |
| %         | root             |
| %         | wiki             |
| %         | zentao           |
| localhost | gitee_production |
| localhost | mysql.session    |
| localhost | mysql.sys        |
| localhost | mysqld_exporter  |
| localhost | root             |
| localhost | wiki             |
| localhost | zentao           |
+-----------+------------------+
4)配置数据库认证。mysqld_exports需要连接数据库服务器的用户名和密码,这里可以通过两种方式向exporter提供此内容。
使用环境变量。创建一个名为“DATA_SOURCE_NAME”的环境变量,格式如下:
export DATA_SOURCE_NAME='user:password@(hostname:3306)/'
使用配置文件。创建一个文件“.mysqld_exporter.cnf”,并在该文件中输入用户名和密码。格式如下:
[client]
user=xxxx
password=xxxx
port=3306
host=127.0.0.1
我们选择使用第二种方法,在与“mysqld_exports”文件同目录下创建“.mysqld_exporter.cnf”文件,并添加如下内容
[root@localhost mysql_exporter]# cat .mysqld_exporter.cnf
[client]
user=mysqld_exporter
password=OSChina@2021
port=3306
host=192.168.1.61
查看目录结构
$ tree -a mysqld_exporter/
mysql_exporter/
├── LICENSE
├── mysqld_exporter
└── .mysqld_exporter.cnf

$ mkdir -p /data/mysqld_exporter/
$ cp mysqld_exporter /data/mysqld_exporter/
$ cp .mysqld_exporter.cnf /data/mysqld_exporter/
5)启动mysqld_exporter
$ ./mysqld_exporter --config.my-cnf=".mysqld_exporter.cnf"
INFO[0000] Starting mysqld_exporter (version=0.11.0, branch=HEAD, revision=5d7179615695a61ecc3b5bf90a2a7c76a9592cdd)  source="mysqld_exporter.go:206"
INFO[0000] Build context (go=go1.10.3, user=root@3d3ff666b0e4, date=20180629-15:00:35)  source="mysqld_exporter.go:207"
INFO[0000] Enabled scrapers:                             source="mysqld_exporter.go:218"
INFO[0000]  --collect.global_variables                   source="mysqld_exporter.go:222"
INFO[0000]  --collect.slave_status                       source="mysqld_exporter.go:222"
INFO[0000]  --collect.info_schema.tables                 source="mysqld_exporter.go:222"
INFO[0000]  --collect.global_status                      source="mysqld_exporter.go:222"
INFO[0000] Listening on :9104                            source="mysqld_exporter.go:232"
6)添加mysqld_exporter,为系统服务启动。
创建系统服务启动配置文件mysqld_exporter.service:
$ cat > /usr/lib/systemd/system/mysqld_exporter.service <<EOF
[Unit]
Description=Prometheus MySQL Exporter
After=network.target
User=root
Group=root

[Service]
Type=simple
Restart=always
ExecStart=/data/mysqld_exporter/mysqld_exporter \
--config.my-cnf=/data/mysqld_exporter/.mysqld_exporter.cnf \
--collect.global_status \
--collect.auto_increment.columns \
--collect.info_schema.processlist \
--collect.binlog_size \
--collect.info_schema.tablestats \
--collect.global_variables \
--collect.info_schema.innodb_metrics \
--collect.info_schema.query_response_time \
--collect.info_schema.userstats \
--collect.info_schema.tables \
--collect.perf_schema.tablelocks \
--collect.perf_schema.file_events \
--collect.perf_schema.eventswaits \
--collect.perf_schema.indexiowaits \
--collect.perf_schema.tableiowaits \
--collect.slave_status \
--web.listen-address=0.0.0.0:9104
ExecStop=-/sbin/start-stop-daemon --quiet --stop --retry QUIT/5
TimeoutStopSec=5
KillMode=mixed

[Install]
WantedBy=multi-user.target
EOF
可以使用命令:#./mysqld_exporter-h查看相关帮助信息,依据实际监控内容配置启动文件。最后可以通过systemctl命令进行各种操作,例如:
systemctl daemon-reload
systemctl enable mysqld_exporter.service
systemctl start mysqld_exporter.service
systemctl status mysqld_exporter.service
$ netstat -tunpl|grep 9104
tcp6       0      0 :::9104                 :::*                    LISTEN      11629/mysqld_export
综上,我们完成了对mysqld_exporter的下载安装,并对其进行了系统服务添加和开机启动设置。通过浏览器访问主机页面地址http://192.168.1.35:9104/metrics,可以看到此刻采集到的样本数据,mysql_up的值为1,即MySQL为启动运行状态,版本信息为5.7.20,部分内容如下所示:
# HELP mysql_up Whether the MySQL server is up.
# TYPE mysql_up gauge
mysql_up 1
# HELP mysql_version_info MySQL version and distribution.
# TYPE mysql_version_info gauge
mysql_version_info{innodb_version="5.7.32",version="5.7.32-log",version_comment="Source distribution"} 1
# HELP mysqld_exporter_build_info A metric with a constant '1' value labeled by version, revision, branch, and goversion from which mysqld_exporter was built.
# TYPE mysqld_exporter_build_info gauge
mysqld_exporter_build_info{branch="HEAD",goversion="go1.10.3",revision="5d7179615695a61ecc3b5bf90a2a7c76a9592cdd",version="0.11.0"} 1
# HELP process_cpu_seconds_total Total user and system CPU time spent in seconds.
# TYPE process_cpu_seconds_total counter
process_cpu_seconds_total 0
# HELP process_max_fds Maximum number of open file descriptors.
# TYPE process_max_fds gauge
process_max_fds 1024
# HELP process_open_fds Number of open file descriptors.
# TYPE process_open_fds gauge
process_open_fds 9
# HELP process_resident_memory_bytes Resident memory size in bytes.
# TYPE process_resident_memory_bytes gauge
process_resident_memory_bytes 5.021696e+06
# HELP process_start_time_seconds Start time of the process since unix epoch in seconds.
# TYPE process_start_time_seconds gauge
process_start_time_seconds 1.61542929271e+09
# HELP process_virtual_memory_bytes Virtual memory size in bytes.
# TYPE process_virtual_memory_bytes gauge
process_virtual_memory_bytes 1.4667776e+07
2.与Prometheus集成
在Prometheus的配置文件prometheus.yml中的static_configs模块内,继续追加配置内容来采集mysqld_exporter提供的数据。添加的参考配置内容如下:
- job_name: 'mysqld_exporter_node'
  scrape_interval: 10s
  static_configs:
  - targets: ['192.168.1.35:9104']
类似地对于可视化配置而言,在Grafana官网选择适用于监控MySQL的模板(过滤条件:name/description=mysql and data source=Prometheus),复制其ID——12826
3.metrics
查看mysqld_exporter服务正常运行时,通过浏览器访问被监控MySQL主机的页面地址http://192.168.1.35:9104/metrics,可以直接查看当前被监控MySQL的采集信息。对于数据库管理员来说,MySQL数据库的性能状态监控内容非常多,但通常必不可少的内容包括查询吞吐量(Query throughput)、查询执行性能(Query execution performance)、连接情况(Connections)和缓冲池使用情况(Buffer pool usage)这四个与基本的性能和资源利用率相关的指标。
1)查询吞吐量
监控任何系统时,我们的主要关注点是确保系统工作有效完成。数据库运行时会完成大量的查询操作,所以监控优先级应该确保MySQL按照预期执行查询。MySQL有一个名为Questions的内部计数器,MySQL术语为“服务器状态变量”。对于客户端应用程序发送的所有语句,该计数器都是递增的。要查询服务器状态变量,可以使用MySQL提供的命令进行查询:
mysql> show global status like "Questions";
+---------------+---------+
| Variable_name | Value   |
+---------------+---------+
| Questions     | 4154298 |
+---------------+---------+
1 row in set (0.00 sec)

对应mysqld_exporter采集后再返回的样本数据中,使用
mysql_global_status_questions展示当前的Questions大小
mysql_global_status_queries 4.153952e+06
# HELP mysql_global_status_questions Generic metric from SHOW GLOBAL STATUS.
# TYPE mysql_global_status_questions untyped
mysql_global_status_questions 4.153797e+06
(2)查询执行性能
关于查询执行性能表现方面,可以使用MySQL提供的Slow_queries计数器,每当查询的执行时间超过long_query_time参数指定的秒数时,计数器就会增加。默认阈值为10秒。下面使用MySQL提供的命令进行查询:
mysql> show global status like "Slow_queries";
+---------------+-------+
| Variable_name | Value |
+---------------+-------+
| Slow_queries  | 0     |
+---------------+-------+
1 row in set (0.00 sec)

对应mysqld_exporter采集后再返回的样本数据中,使用mysql_global_status_slow_queries来展示结果
mysql_global_status_slow_launch_threads 0
# HELP mysql_global_status_slow_queries Generic metric from SHOW GLOBAL STATUS.
# TYPE mysql_global_status_slow_queries untyped
mysql_global_status_slow_queries 0
(3)连接情况为了防止MySQL服务器的过载运行,数据库管理员需要根据业务量进行预评估,以便限制客户端连接MySQL的数量。这里使用的MySQL5.7版本,在my.cnf文件配置了最大连接数max_connections=512。使用MySQL提供的命令进行查询,如下所示:
mysql> show variables like "max_connections";
+-----------------+-------+
| Variable_name   | Value |
+-----------------+-------+
| max_connections | 500   |
+-----------------+-------+
1 row in set (0.00 sec)


对应mysqld_exporter采集后再返回的样本数据中,mysql_global_variables_max_connections 来展示结果
mysql_global_variables_max_connections 500

数据库管理需要查看MySQL当前实例的连接数,即Threads_connected数值,可使用MySQL提供的命令进行查询,如下所示:
mysql> show global status like "Threads_connected";
+-------------------+-------+
| Variable_name     | Value |
+-------------------+-------+
| Threads_connected | 1     |
+-------------------+-------+
1 row in set (0.00 sec)

mysql_global_status_threads_connected 1
当设置的所有可用连接都被占用完时,若再有客户端进行连接MySQL,就会出现连接数过多的错误提示信息。我们可以使用以下相关的监控指标进行核查:
# HELP mysql_global_status_connection_errors_total Total number of MySQL connection errors.
# TYPE mysql_global_status_connection_errors_total counter
mysql_global_status_connection_errors_total{error="accept"} 0
mysql_global_status_connection_errors_total{error="internal"} 0
mysql_global_status_connection_errors_total{error="max_connections"} 0
mysql_global_status_connection_errors_total{error="peer_address"} 0
mysql_global_status_connection_errors_total{error="select"} 0
mysql_global_status_connection_errors_total{error="tcpwrap"} 0
# HELP mysql_global_status_connections Generic metric from SHOW GLOBAL STATUS.
# TYPE mysql_global_status_connections untyped
mysql_global_status_connections 7476
(4)缓存池使用情况当MySQL默认的存储引擎是InnoDB时,会使用缓冲池来缓存表和索引的数据。即便是初级数据库管理员,在部署MySQL实例时,也会提前预估并在my.cnf文件中配置参数innodb_buffer_pool_size。这是InnoDB最重要的参数,主要作用是缓存innodb表的索引、数据和插入数据,默认值为128M。
通常,当我们查看Innodb_buffer_pool_reads的数量时,使用MySQL提供的命令,如下所示:
mysql> show global status like "Innodb_buffer_pool_reads";
+--------------------------+-------+
| Variable_name            | Value |
+--------------------------+-------+
| Innodb_buffer_pool_reads | 1101  |
+--------------------------+-------+
1 row in set (0.01 sec)

对应mysqld_exporter中,可以通过mysql_global_status_innodb_buffer_pool_reads查看指标数量,如下所示:
# HELP mysql_global_status_innodb_buffer_pool_reads Generic metric from SHOW GLOBAL STATUS.
# TYPE mysql_global_status_innodb_buffer_pool_reads untyped
mysql_global_status_innodb_buffer_pool_reads 875
若MySQL server集成在Windows操作系统且64位版本时,可以下载对应的软件包,如mysqld_exporter-0.11.0.windows-amd64.tar.gz。在Windows环境中使用可执行程序mysqld_exporter.exe进行相关内容的操作。
总体与Linux操作系统下对MySQL数据的采集过程一样,即Prometheus使用mysqld_exporter采集MySQL的数据,然后对Prometheus进行配置,再获取mysqld_exporter采集到的各项监控指标,数据存放到Prometheus所在服务器的磁盘数据文件中。
参考文献:
2 Redis exporter 单节点
1.软件下载与部署
1)下载redis_exporter。
下载地址为https://github.com/oliver006/redis_exporter/releases。选择当时最新版本redis_exporter-v0.23.0.linux-amd64.tar.gz,对Redis 2.x,3.x,4.x,and 5.x版本均支持。
$ wget https://github.com/oliver006/redis_exporter/releases/download/v1.3.5/redis_exporter-v1.3.5.linux-amd64.tar.gz
$ tar -xvf redis_exporter-v1.3.5.linux-amd64.tar
$ cd redis_exporter-v1.3.5.linux-amd64/
2)解压缩软件包到指定的安装目录:
redis_exporter 常用的选项:
-redis.addr:指明一个或多个 Redis 节点的地址,多个节点使用逗号分隔,默认为 redis://localhost:6379
-redis.password:验证 Redis 时使用的密码;
-redis.file:包含一个或多个redis 节点的文件路径,每行一个节点,此选项与 -redis.addr 互斥。
-web.listen-address:监听的地址和端口,默认为 0.0.0.0:9121
#进入安装目录下,在终端启动查看信息,成功启动,默认监听端口是9121
$ ./redis_exporter -redis.addr localhost:6379
INFO[0000] Redis Metrics Exporter v0.23.0    build date: 2018-12-03-17:29:45    sha1: 10045b85b5aaa1c5fa35                                         ba38e3a1aee14f772b31    Go: go1.11.2
INFO[0000] Providing metrics at :9121/metrics
INFO[0000] Connecting to redis hosts: []string{"localhost:6379"}
INFO[0000] Using alias: []string{""}

# 或者更改监听端口
$ ./redis_exporter -web.listen-address "0.0.0.0:9122" redis//127.0.0.1:6380
3)添加redis_exporter为系统服务开机启动配置文件redis_exporter.service:
$ cat /usr/lib/systemd/system/redis_exporter.service
[Unit]
Description=Prometheus Redis Exporter
After=network.target

[Service]
Type=simple
Restart=always
ExecStart=/data/redis_exporter/redis_exporter \
-redis.addr localhost:6379

[Install]
WantedBy=multi-user.target
Redis server若设置过密码登录,以上文件内容需要设置redis连接地址和密码。可以使用命令:#./redis_exporter-h查看相关帮助信息,依据实际监控内容配置启动文件。
同样,可以通过systemctl命令重新加载配置文件,并设置redis_exporter.service为开机自启动后进行开启,查看状态、重启和停止服务操作。
systemctl daemon-reload
systemctl enable redis_exporter.service
systemctl start redis_exporter.service
systemctl status redis_exporter.service
综上,我们完成了对redis_exporter的下载安装,使用浏览器访问主机页面地址http://192.168.1.35:9121/metrics,可以看到其运行状态为UP,如下所示:
# HELP redis_up upmetric
# TYPE redis_up gauge
redis_up{addr="localhost:6379",alias=""} 1
2.与Prometheus集成
在Prometheus的配置文件prometheus.yml中的static_configs模块内,继续追加配置内容来采集redis_exporter提供的数据。参考配置内容如下:
- job_name: 'redis_exporter'
  scrape_interval: 10s
  static_configs:
  - targets: ['192.168.1.35:9121']
    labels:
      instance: bt-redis
配置完成后,仍然需要我们重新启动Prometheus或动态热加载,对配置文件进行加载生效操作。现在,可以在浏览器中输入Prometheus示例页面地址http://192.168.1.37:9090/targets,访问Prometheus Web UI提供的内容,可以看到在Targets页面列表中已经新增了redis_exporter显示项,且redis_exporter状态为“UP”。
3. 配置 Grafana 的模板
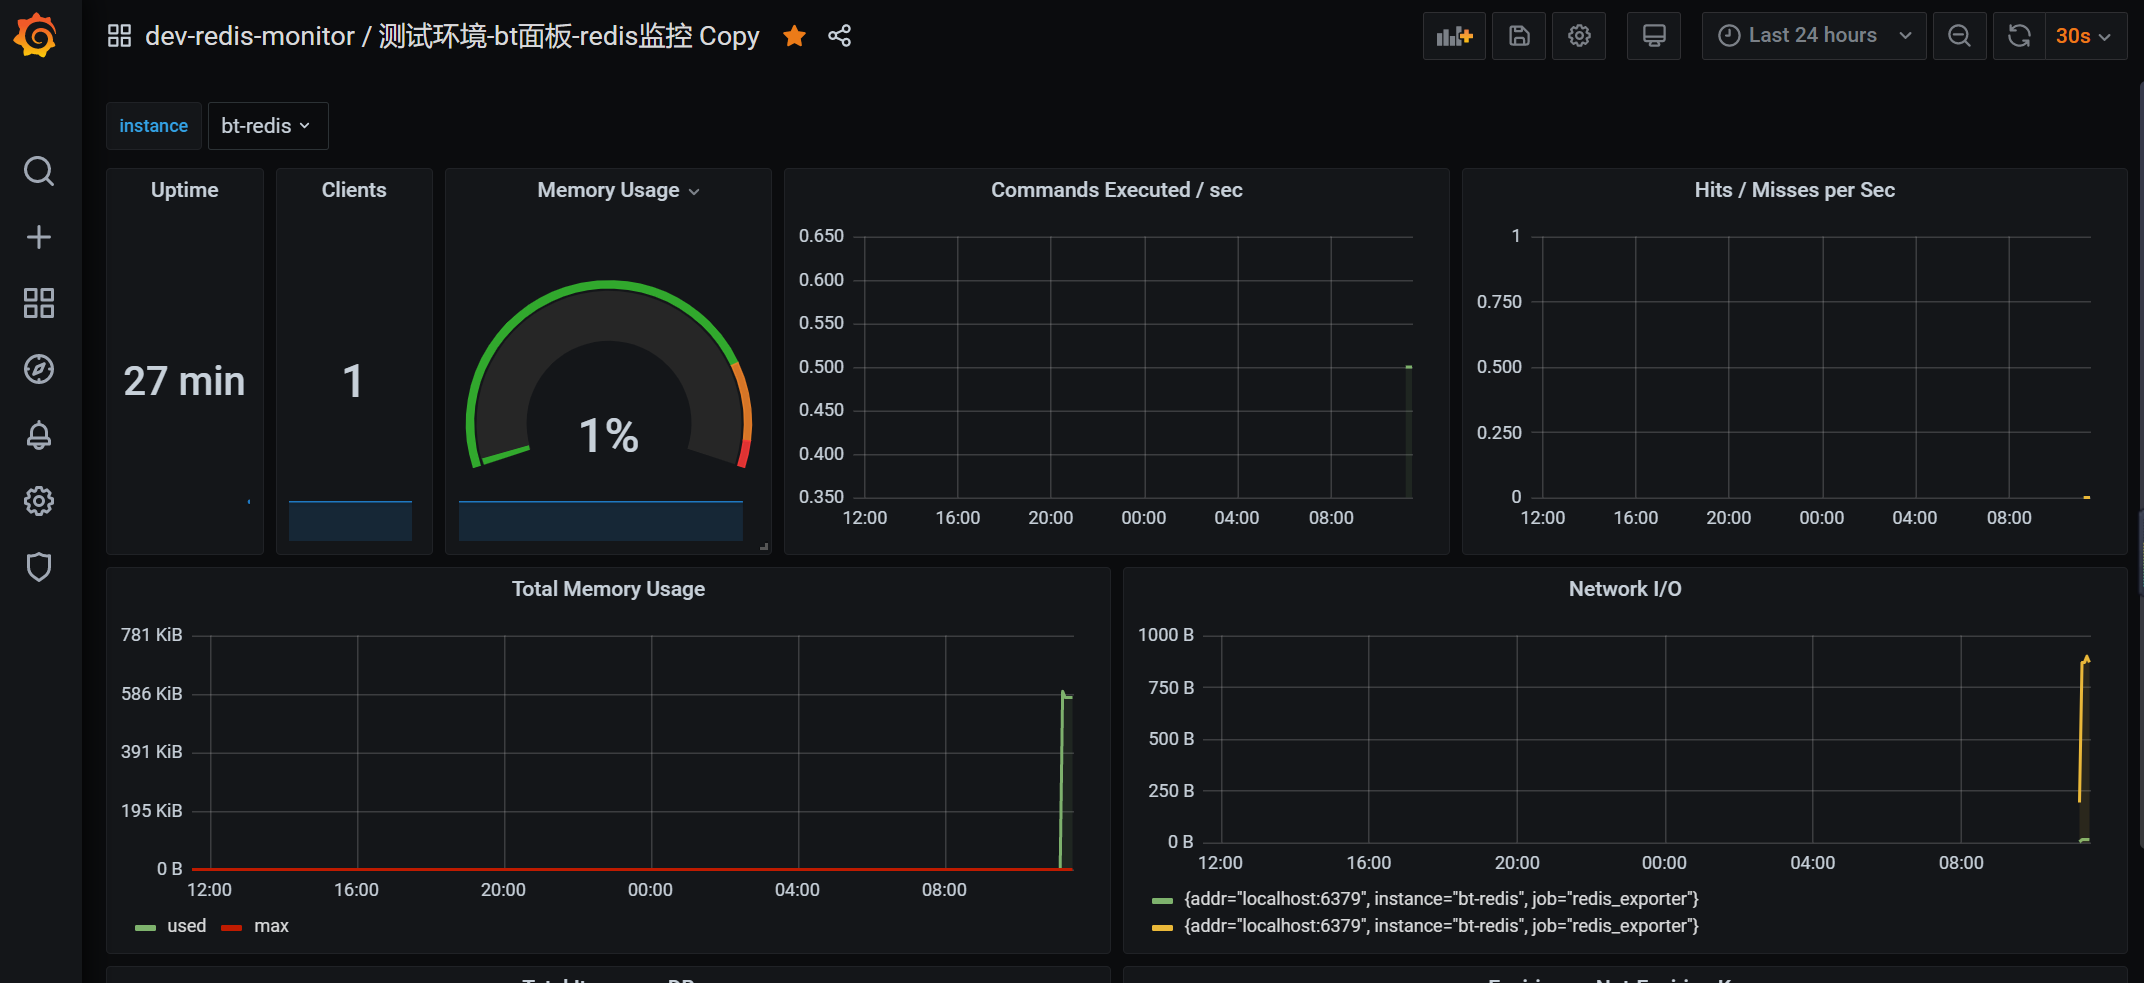
redis_exporter 在 Grafana 上为我们提供好了 Dashboard 模板:https://grafana.com/dashboards/763
下载后在 Grafana 中导入 json 模板就可以看到官方这样的示例截图啦:
参考文献:
3. Redis exporter监控redis集群
参考文献:
2.2.5 Nginx监控
在Prometheus官方文档中提供了2个Nginx使用的第三方Exporter:Nginxmetric library和nginx-vts-exporter。这里我们使用nginx-vts-exporter对已经安装好的Nginx服务进行监控数据采集。
在安装nginx-vts-exporter前,如果你正在安装Nginx服务,此时,需要安装支持第三方的nginx virtual host traffic status模块,提供对虚拟主机状态信息的访问,它包含当前状态,如服务器、upstreams、缓存,即进行模块加载操作:
./configure --add-module=/path/to/nginx-module-vts
nginx-module-vts在Nginx官网上的第三方栏目中推荐下载页面地址https://github.com/vozlt/nginx-module-vts,也可以直接使用git进行clone操作git clone git://github.com/vozlt/nginx-module-vts.git。若没有加载nginx-module-vts模块支持,想要通过重新编译加载模块时,需要备份原来的应用环境,再加载此模块。模块加载完成后,需要在Nginx配置文件中添加如下格式的配置内容:
http {
    vhost_traffic_status_zone;

    ...

    server {

        ...

        location /status {
            vhost_traffic_status_bypass_stats on;
            vhost_traffic_status_display;
            vhost_traffic_status_display_format html;
        }
    }
}
正确添加后,重新加载Nginx配置文件使配置生效,通过浏览器访问/status,可以看到Nginx模块nginx-module-vts已经开始正常运行。

1.软件下载与部署
1)下载nginx-vts-exporter。
下载页面地址为https://github.com/hnlq715/nginx-vts-exporter/releases。选择当时最新版本nginx-vts-exporter-0.10.3.linux-amd64.tar.gz,支持nginx-1.4..x版本和nginx-1.6.x以上版本。
2)解压缩软件包到指定的安装目录:
# 默认监听端口9913
./nginx-vts-exporter -nginx.scrape_uri http://localhost/status/format/json
3)添加nginx-vts-exporter为系统服务开机启动配置文件nginx-vts-exporter.service:
[Unit]
Description=Prometheus Nginx VTS Exporter
After=network.target
User=nginx
Group=nginx

[Service]
Type=simple
Restart=always
ExecStart=/data/nginx-vts-exporter/nginx-vts-exporter\
-nginx.scrape_uri http://localhost/status/format/json

[Install]
WantedBy=multi-user.target
这里需要注意的是如果没有-nginx.scrape_uri参数,默认访问的状态地址是http://localhost/status。如果想修改访问端口,使用参数-telemetry.addressstring即可。最后可以通过systemctl命令进行各种操作。
综上,我们完成了对nginx-vts-exporter的下载安装,并对其进行了系统服务添加和开机启动设置。使用浏览器访问示例主机页面地址http://192.168.1.379913/metrics,可以查看所有采集数据信息。
2.与Prometheus集成
在Prometheus的配置文件prometheus.yml中继续追加static_configs来采集redis_exporter提供的数据。添加的参考配置内容如下:
- job_name: nginx-vts
  static_configs:
    - targets: ['192.168.1.37:9913']
      labels:
        instance: localhost-nginx-vts
配置完成后,仍然需要我们重新启动Prometheus或动态热加载配置文件。现在,可以在浏览器中输入Prometheus示例页面地址http://192.168.24.17:9090,访问Prometheus Web UI提供的页面内容,在Targets页面列表中已经新增了nginx-vts-exporter显示项,且nginx-vts-exporter状态为“UP”。
curl -X POST http://192.168.1.37:9090/-/reload
参考文献:
2.2.6 Prometheus之黑盒监控
Exporter的使用可以称为“白盒监控”,即需要把对应的Exporter程序安装到被监控的目标主机上,从而实现对主机各种资源及其状态的数据采集工作。但是由于某些情况下操作技术或其他原因,不是所有的Exporter都能部署到被监控的主机环境中,最典型的例子是监控全国网络质量的稳定性,通常的方法是使用ping操作,对选取的节点进行ICMP测试,此时不可能在他人应用环境中部署相关的Exporter程序。
针对这样的应用的场景,Prometheus社区提供了黑盒解决方案,Blackbox Exporter无须安装在被监控的目标环境中,用户只需要将其安装在与Prometheus和被监控目标互通的环境中,通过HTTP、HTTPS、DNS、TCP、ICMP等方式对网络进行探测监控,还可以探测SSL证书过期时间。
1.下载安装包
在安装之前,首先在官方下载页面https://prometheus.io/download/中找到blackbox_exporter列表,下载最新版本中特定平台的二进制文件。
或者直接在官方的Prometheus GitHub下载页面https://github.com/prometheus/blackbox_exporter/releases中下载指定blackbox_exporte版本所对应的特定平台的二进制文件。然后我们开始blackbox_exporter在主机中的安装部署使用工作。
2.软件安装与部署
1)官网下载blackbox_exporter
2)解压缩软件包到指定的安装目录。
tar -zxvf blackbox_exporter-0.14.0.linux-amd64.tar.gz  -C /data/

cd /data
ln -sv blackbox_exporter-0.14.0.linux-amd64 blackbox_exporter
3)添加blackbox_exporter为系统服务开机启动。同样,为了维护方便,将blackbox_exporter添加为系统服务且开机自启动。开始创建系统服务启动配置文件blackbox_exporter.service:
[root@localhost blackbox_exporter]# cat /usr/lib/systemd/system/blackbox_exporter.service
[Unit]
Description=blackbox_exporter
After=network.target

[Service]
Type=simple
User=root
Group=root
ExecStart=/data/blackbox_exporter/blackbox_exporter \
          --config.file "/data/blackbox_exporter/blackbox.yml" \
          --web.listen-address ":9115"
Restart=on-failure

[Install]
WantedBy=multi-user.target
可以通过systemctl命令进行各种操作。
systemctl daemon-reload
systemctl enable blackbox_exporter.service
systemctl start blackbox_exporter.service
systemctl status blackbox_exporter.service
[root@localhost blackbox_exporter]# ps aux |grep blackbox_exporter
root      1657  0.0  0.0 112764  7956 ?        Ssl  01:19   0:00 /data/blackbox_exporter/blackbox_exporter --config.file /data/blackbox_exporter/blackbox.yml --web.listen-address :9115
root      1670  0.0  0.0 112808   972 pts/1    S+   01:19   0:00 grep --color=auto blackbox_exporter
其中配置文件直接使用了默认的blackbox.yml文件,blackbox_exporter正常启动后,可以查看到服务状态为Active:active(running),并且开启默认端口9115进行监听。现在使用浏览器访问示例地址http://192.168.1.37:9115/,

Blackbox Exporter控制台包括允许监控自身的指标,可以点击“Metics”链接,如图中示例,访问地址http://192.168.1.37:9115/metrics可进行查看。控制台还包含最近执行的探测列表,它们的状态以及显示发生的事件的调试日志,这些对于调试探测很有用。
# HELP blackbox_exporter_build_info A metric with a constant '1' value labeled by version, revision, branch, and goversion from which blackbox_exporter was built.
# TYPE blackbox_exporter_build_info gauge
blackbox_exporter_build_info{branch="HEAD",goversion="go1.11.5",revision="bba7ef76193948a333a5868a1ab38b864f7d968a",version="0.14.0"} 1
# HELP blackbox_exporter_config_last_reload_success_timestamp_seconds Timestamp of the last successful configuration reload.
# TYPE blackbox_exporter_config_last_reload_success_timestamp_seconds gauge
blackbox_exporter_config_last_reload_success_timestamp_seconds 1.6154435566517625e+09
# HELP blackbox_exporter_config_last_reload_successful Blackbox exporter config loaded successfully.
# TYPE blackbox_exporter_config_last_reload_successful gauge
blackbox_exporter_config_last_reload_successful 1
# HELP go_gc_duration_seconds A summary of the GC invocation durations.
# TYPE go_gc_duration_seconds summary
go_gc_duration_seconds{quantile="0"} 0
go_gc_duration_seconds{quantile="0.25"} 0
go_gc_duration_seconds{quantile="0.5"} 0
go_gc_duration_seconds{quantile="0.75"} 0
go_gc_duration_seconds{quantile="1"} 0
go_gc_duration_seconds_sum 0
go_gc_duration_seconds_count 0
# HELP go_goroutines Number of goroutines that currently exist.
# TYPE go_goroutines gauge
配置文件
blackbox_exporter的默认配置文件是blackbox.yml,使用YAML格式,如果格式不符合语法要求,Blackbox Exporter将无法启动。在配置过程中,首先需要在Blackbox Exporter的配置文件中定义监测模块内容,然后在Prometheus Server的配置文件中声明用对应的模块去探测相应的targets。默认配置文件中常用的几个监测模块信息如下.
modules:
  http_2xx:
    prober: http
  http_post_2xx:
    prober: http
    http:
      method: POST
  tcp_connect:
    prober: tcp
  pop3s_banner:
    prober: tcp
    tcp:
      query_response:
      - expect: "^+OK"
      tls: true
      tls_config:
        insecure_skip_verify: false
  ssh_banner:
    prober: tcp
    tcp:
      query_response:
      - expect: "^SSH-2.0-"
  irc_banner:
    prober: tcp
    tcp:
      query_response:
      - send: "NICK prober"
      - send: "USER prober prober prober :prober"
      - expect: "PING :([^ ]+)"
        send: "PONG ${1}"
      - expect: "^:[^ ]+ 001"
  icmp:
    prober: icmp
1.http探测配置
检查HTTP状态,可以使用http探测器。它可以生成HTTP请求使用,如GET或POST方法,配置操作中可以定义请求超时时间,可以使用正则表达式进行相关匹配。首先,我们在blackbox.yml文件中添加HTTP监测模块,
modules:
  http_2xx:
    prober: http
    timeout: 10s
    http:
      preferred_ip_protocol: "ip4"
  http_post_2xx:
    prober: http
    http:
      method: POST
      preferred_ip_protocol: "ip4"
  tcp_connect:
    prober: tcp
  pop3s_banner:
    prober: tcp
    tcp:
      query_response:
      - expect: "^+OK"
      tls: true
      tls_config:
        insecure_skip_verify: false
  ssh_banner:
    prober: tcp
    tcp:
      query_response:
      - expect: "^SSH-2.0-"
  irc_banner:
    prober: tcp
    tcp:
      query_response:
      - send: "NICK prober"
      - send: "USER prober prober prober :prober"
      - expect: "PING :([^ ]+)"
        send: "PONG ${1}"
      - expect: "^:[^ ]+ 001"
  icmp:
    prober: icmp
配置完成后通过重启BlackboxExporter服务或热加载方式:
curl -X POST http://192.168.1.37:9090/-/reload
使得配置文件生效。
2.与Prometheus集成
与Prometheus进行配置集成,需要在prometheus.yml文件中配置对BlockboxExporter实例的采集任务,以下为添加的参考配置内容:
- job_name: 'blackbox_http'
  metrics_path: /probe
  params:
    module: [http_2xx]
  static_configs:
    - targets:
      - www.12306.cn
      - www.baidu.com
  relabel_configs:
    - source_labels: [__address__]
      target_label: __param_target
    - source_labels: [__param_target]
      target_label: instance
    - target_label: __address__
      replacement: 192.168.1.37:9115
通过命令curl模拟http请求,可以看到输出的Metrics信息
[root@localhost conf]# curl "http://192.168.1.37:9115/probe?module=http_2xx&target=www.12306.cn"
.....

# HELP probe_http_ssl Indicates if SSL was used for the final redirect
# TYPE probe_http_ssl gauge
probe_http_ssl 1
# HELP probe_http_status_code Response HTTP status code
# TYPE probe_http_status_code gauge
probe_http_status_code 200
# HELP probe_http_version Returns the version of HTTP of the probe response
# TYPE probe_http_version gauge
probe_http_version 1.1
# HELP probe_ip_protocol Specifies whether probe ip protocol is IP4 or IP6
# TYPE probe_ip_protocol gauge
probe_ip_protocol 4
# HELP probe_ssl_earliest_cert_expiry Returns earliest SSL cert expiry in unixtime
# TYPE probe_ssl_earliest_cert_expiry gauge
probe_ssl_earliest_cert_expiry 1.641513599e+09
# HELP probe_success Displays whether or not the probe was a success
# TYPE probe_success gauge
probe_success 1
URL地址中使用的探针是通过其中的module参数来指定的,而target参数用来指定探测目标,探针所探测的结果通过Metrics的形式返回。从返回的样本中,用户可以获取站点的DNS解析耗时、响应时间、响应状态码、probe_http_ssl指示最终重定向是否使用SSL和指标probe_success为1的成功状态等相关监控指标。
我们可以使用浏览器访问示例地址http://192.168.1.37:9090/targets

如监控目标过多,prometheus.yml文件配置中的targets指定被探测目标地址时,就会使得配置文件过于“臃肿”。现在我们使用“file_sd_configs”重新对prometheus.yml进行配置,操作如下:
mkdir /data/PromStack/prometheus/conf/probes -p
vim /data/PromStack/prometheus/conf/probes/http_probes.json
[
    {
        "targets":[
            "www.12306.cn",
            "www.baidu.com",
            "www.taobao.com",
            "www.jd.com",
            "www.qq.com"
        ]
    }
]
vim prometheus.yml
- job_name: 'blackbox_http'
  metrics_path: /probe
  params:
    module: [http_2xx]
  file_sd_configs:
    - files:
      - '/etc/prometheus/probes/*.json'
      refresh_interval: 5m
  relabel_configs:
    - source_labels: [__address__]
      target_label: __param_target
    - source_labels: [__param_target]
      target_label: instance
    - target_label: __address__
      replacement: 192.168.1.37:9115
热加载使配置文件生效
curl -X POST http://192.168.1.37:9090/-/reload
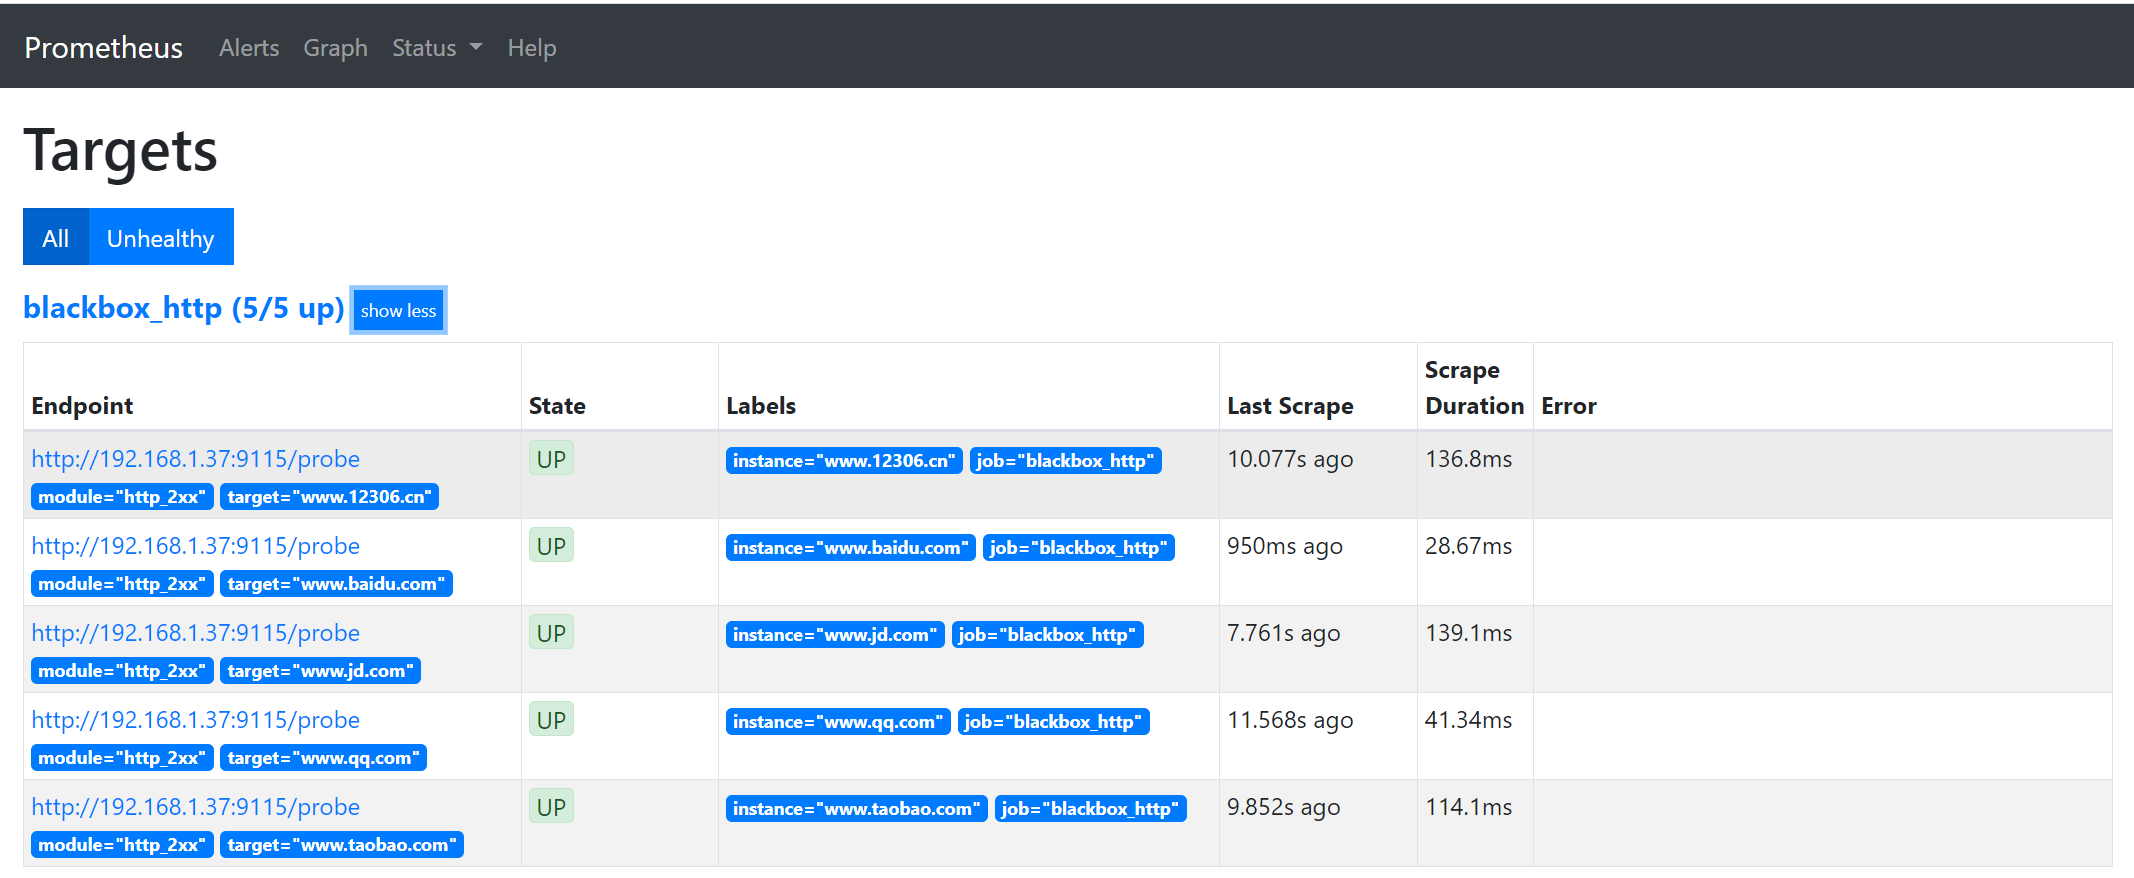
同样,使用浏览器访问http://192.168.1.37:9090/targets,可以查看被探测的目标的target实例
在blackbox.yml配置文件中,http_2xx监测模块对http探测类型进行定义,除以上定义内容外,还可以使用headers定义相关的请求头信息,使用body定义请求内容,针对HTTPS类型的服务可以对证书进行自定义设置,有兴趣的读者可以访问官方提供的配置参考,自己进行相关配置,参考地址https://github.com/prometheus/blackbox_exporter/blob/master/example.yml。
对于Blackbox Exporter,其他HTTPS、DNS、TCP、ICMP、SSH等方式对网络进行探测监控的操作过程都与HTTP探测流程一样,我们这里不一一进行演示,实际环境中有需要的读者可以访问https://www.robustperception.io/tag/blackbox_exporter,选择对应的模块内容,再结合官网提供的配置参考进行实际操作。
3. grafana中加入blackbox_exporter监控数据
此模板为9965号模板,数据源选择Prometheus 模板下载地址 https://grafana.com/grafana/dashboards/9965

参考文献:
2.2.7 Docker监控
监控一个容器服务(``常用的监控指标有: 内存,CPU,硬盘,网络,状态``)
cAdvisor (Container Advisor) 用于收集正在允许的容器资源使用和性能信息。相当于zabbix-agent一样提供一个数据采集的接口
1.docker部署cAdvisor:
被监控服务器安装
docker run -d   \
--volume=/:/rootfs:ro \
--volume=/var/run:/var/run:ro  \
--volume=/sys:/sys:ro  \
--volume=/var/lib/docker/:/var/lib/docker:ro  \
--volume=/dev/disk/:/dev/disk:ro \
--publish=8890:8080 \
--detach=true \
--name=cadvisor \
google/cadvisor:latest
访问该地址,就能看到实时采集到的数据
http://192.168.1.25:8890/containers/
该地址的数据为prometheus识别的数据的接口
http://192.168.1.25:8890/metrics
去监控控制主机上修改prometheus的配置文件,复制一个job文件,job_name 指名称,targets为cAdvisor服务器地址ip和端口
- job_name: "docker"
  static_configs:
  - targets: ['192.168.1.25:8890']
开启内核路由转发
echo -e "net.ipv4.ip_forward = 1\nnet.ipv4.conf.default.rp_filter = 0 \nnet.ipv4.conf.all.rp_filter = 0" >> /etc/sysctl.conf
sysctl -p
热加载使配置文件生效
curl -X POST http://192.168.1.37:9090/-/reload
http://192.168.1.37:9090/targets 可以看到监控指标说明获取数据成功
2. 配置 Grafana 的模板
https://grafana.com/grafana/download #该地址下载grafana模板
使用193模板即可

但是这个模板,无法选择根据主机选择。推荐另外一个模板,它是可以选择主机的。
2.2.8 kubernets监控
http://www.mydlq.club/article/112/
本章小结
Prometheus监控环境中,具有更好的跨平台和可读性的基于文本的数据格式。
Node Exporter对Linux主机进行数据监控采
wmi_exporter对Windows主机进行数据监控采集
mysqld_exporter对MySQL数据库进行数据监控采集
redis_exporter对Redis进行数据监控采集
nginx-vts-exporter对nginx服务进行数据监控采集
Prometheus的黑盒监控,通过对http的探测示例操作,为其他黑盒探测的使用提供了帮助。